The Kernel Change That May Be Slowing Down Your App
A kernel “bug fix” that happened at the end of last year may be killing the performance of your Kubernetes- or Mesos-hosted applications. Here’s how we discovered that it was affecting us and what we did about it at Community.
Bad 90th Percentile
For most of 2019 we were seeing some outlying bad performance across our apps. We run our stack on top of Mesos and Docker. Performance in production seemed worse than when not in production and we are a busy startup and only devoted a bit of time here and there to trying to understand the problem.
In the late summer of 2019 we started to notice that a few of our simplest apps were performing in a noticeably strange way. Both applications should have highly predictable performance, but were seeing response time 90th percentiles that were hugely out of our expectations. We looked into it and while we’re busy ramping up our platform, didn’t take the time to devote to fixing it.
The application we first noticed this with accepts an HTTP request, looks in a Redis cache, and publishes on RabbitMQ. It is written in Elixir, our main app stack. This application’s median response times were somewhere around 7-8ms. It’s 90th percentile was 45-50ms. That is a huge slow down! Appsignal, that we use for Elixir application monitoring, was showing a strange issue where for slow requests, either Redis or RabbitMQ would be slow, and that external call would take almost all of the 45-50ms. Redis and RabbitMQ both deliver very reliable performance until they are under huge, swamping load, so this is a really strange pattern.
We started to look at other applications across our stack in closer detail and found that many of them were seeing the same pattern. It was often just harder to pick out the issue because they were doing more complex operations and had less predictable behavior.
One of those applications accepts a request, talks to Redis, and returns a response. Its median response times were sub-millisecond. We were seeing 90th percentile response times around… 45-50ms! Numbers semm familiar? That application was written in Go.
For those not familiar with how response time percentiles work: a bad 90th percentile means 1 in 10 requests is getting terrible performance. Even having 5% of our requests getting bad performance is completely unacceptable. For complex applications it seemed to affect us less, but we rely on low latency from a couple of apps and it was hurting us.
Digging In
We use Appsignal for monitoring our Elixir applications and New Relic for monitoring Go and Python apps. Our main stack is Elixir, and the first app we saw the issue with was in Elixir, so Appsignal is where most of the troubleshooting happened. We started by looking at our own settings that might be affecting applications. We weren’t doing anything crazy and I was co-troubleshooting at this point was Andrea Leopardi, a member of our team and an Elixir core team member. He and I evaluated the application side and couldn’t find anything wrong. We then started to look at all the underlying components that could be affecting it: network, individual hosts, load balancers, etc and eliminating them one-by-one.
We isolated the application in our dev environment (just like prod, but no load) and gave it an extremely low, but predictable throughput of 1 request per second. Amazingly, we could still see the 90th percentile as a huge outlier. To eliminate any network considerations, we generated the load from the same host. Same behavior! At this point I started to think it was probably a kernel issue but kernel issues are pretty rare in situations like this with basically no load.
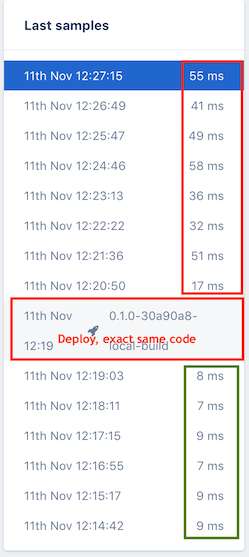
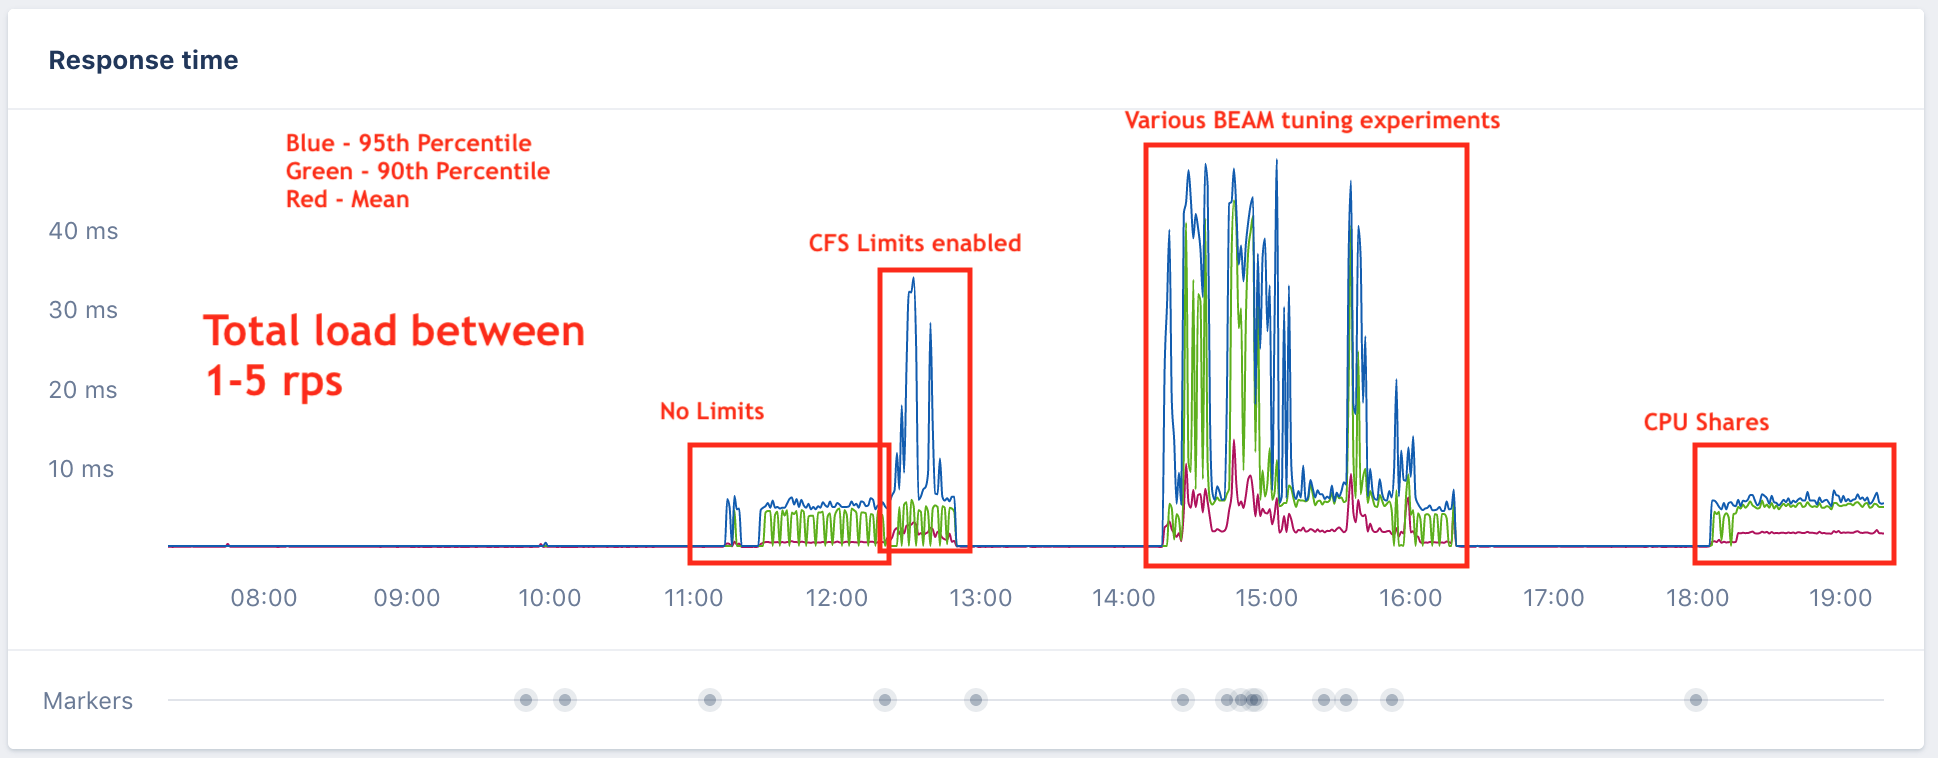
Andrea and I talked through all the issues and decided we had better look at Docker settings as a culprit. We decided to turn off all CPU and memory limits and deploy the application to our dev environment again. Keep in mind there is no load on this application. It is seeing 1 request per second in this synthetic environment. Deployed without limits, it suddenly behaved as expected! To prove that it was CPU limits, my hunch, we re-enabled memory limits, re-deployed, ran the same scenario and we were back to bad performance. The chart at right shows Appsignal sampling the slowest transactions each minute. This is really the max outlier rather than the 90th but we ought to be able to improve that more easily. You can see in the output that without limits (green) it performed fine and with limits (red) it was a mess. Remember, there is basically no load here so the CPU limits shouldn’t much change app performance if they are in place.
We then thought there might be an interaction between the BEAM scheduler (Erlang VM that Elixir runs on) and CPU limits. We tried various BEAM settings with the CPU limits enabled and got little reward for our efforts. We run all of our apps under a custom Mesos executor that I co-wrote with co-workers at Nitro over the last few years before joining Community. With our executor it was easy to switch our enforcement from the Linux Completely Fair Scheduler enforcement that works best for most service workloads, to the older CPU shares style. This would be a compromise position to let us run some applications in production with better performance without turning off limits entirely. Not great, but a start, if it worked. I did that and we measured performance again. Even ramping the throughput up slightly to 5 requests per second, the application performed as expected. The following chart shows all this experimentation:
Jackpot
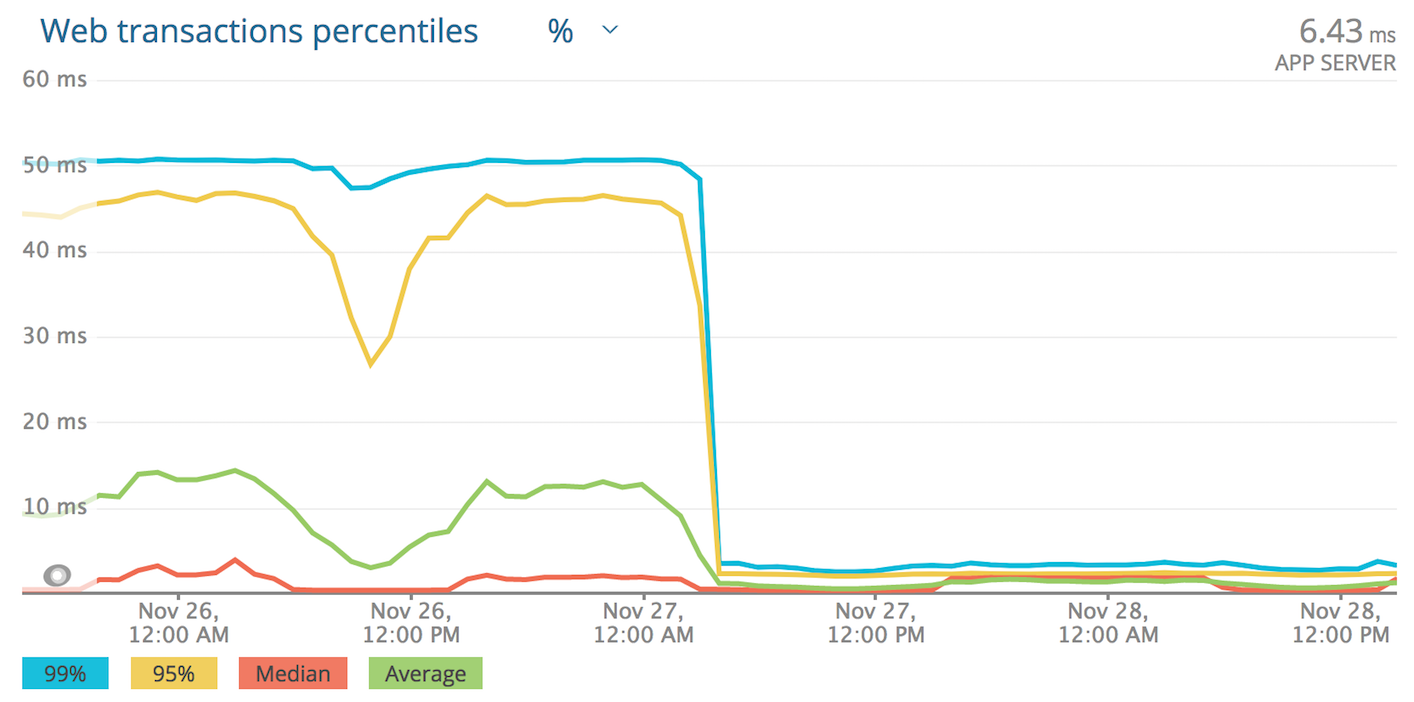
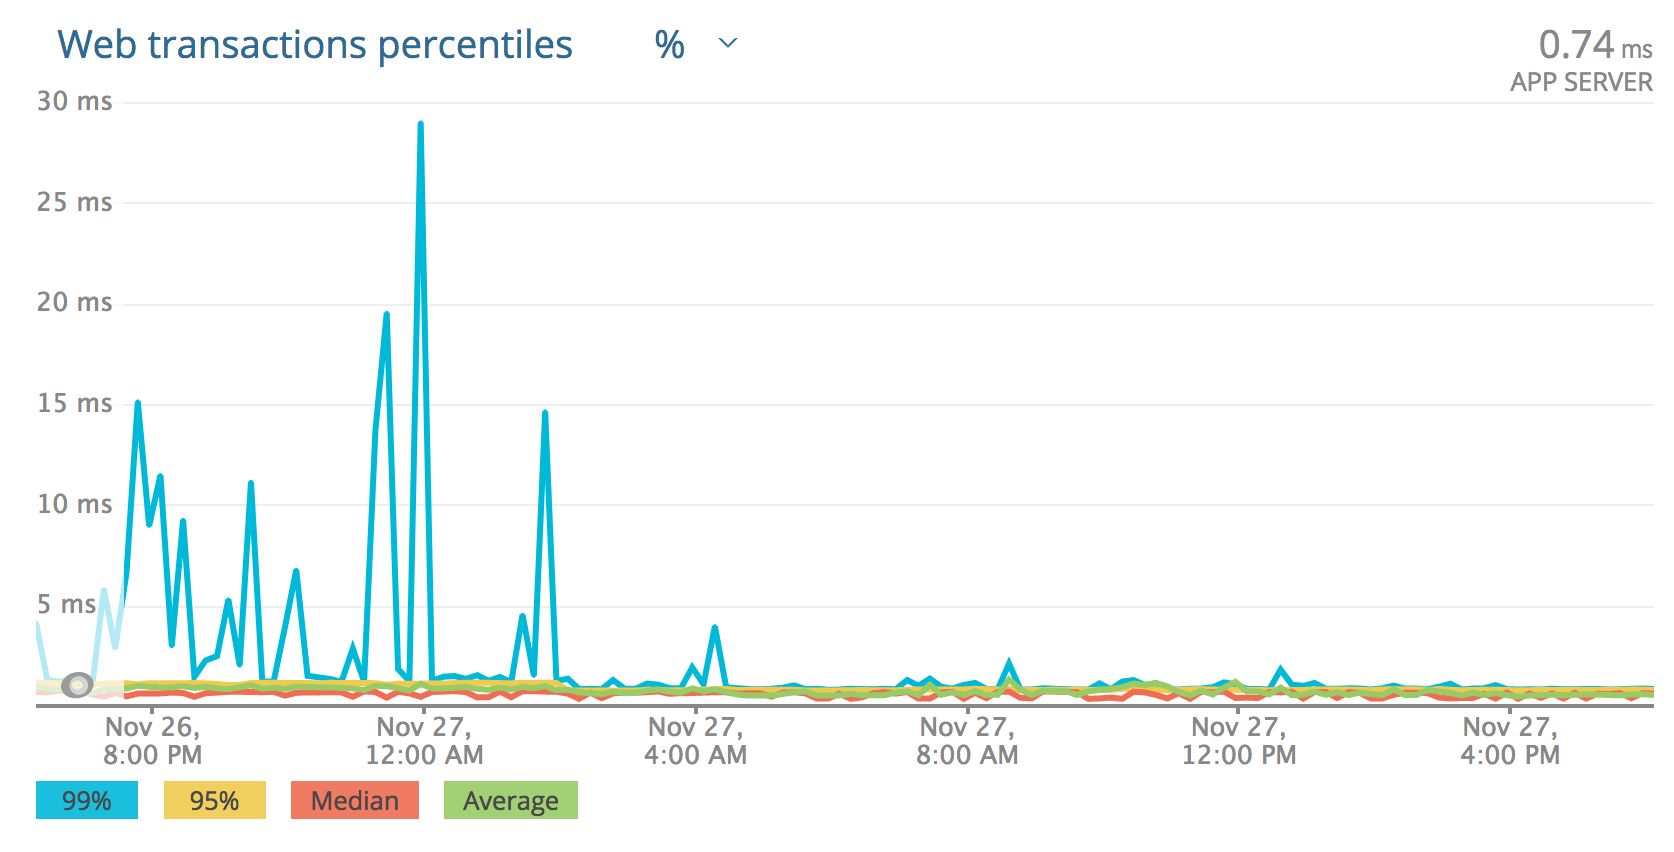
Moving beyond our Elixir core stack, we discovered that we were seeing the same behavior in a Go application and a Python app as well. The Python app’s New Relic chart is the one at the start of this article. Once Andrea and I realized it was affecting non-Elixir apps and was in no way an interaction specific to the BEAM, I started looking for other reports on the Internet of issues with Completely Fair Scheduler CPU limits.
Jackpot! After a bit of work, I came across this issue on the kernel mailing list. Take a quick second to read the opening two paragraphs of that issue. What is happening is that when you have apps that aren’t completely CPU-bound, when you have CPU limits applied, the kernel is effectively penalizing you for CPU time you did not use, as if you were a busy application. In highly threaded environments, this leads to thread starvation for certain workloads. The key here is that the issue says this only affects non-CPU-bound workloads. We found that in practice, it’s really affecting all of our workloads. Contrary to my expectations that it would affect Go and BEAM schedulers the worst, in fact, one of the most affected workloads was a Python webapp.
The other detail that might not be clear from first read of that Kernel issue is that the behavior that is killing our performance is how the kernel was supposed to work originally. But in 2014, a patch was applied that effectively disabled the slice expiration. It has been broken (according to the design) for 4.5 years. Everything was good until that “bug” was fixed and the original, intended behavior was unblocked. The recent work to fix this issue involves actually returning to the previous status quo by removing the expiration “feature” entirely.
If you run on K8s or Mesos, or another platform that uses the Linux CFS CPU limits, you are almost certainly getting affected by this issue as well. At least for all the blends of Linux I looked at, and unless your kernel is more than about a year old.
Fixing It
So, what to do about it? We run Ubuntu 16.04 LTS and looking at the available
kernels on the LTS stream, there was nothing that included the fix. This was a
month ago. To get a kernel that had the right patches, Dan
Selans and I had to enable the proposed package
stream for Ubuntu and upgrade to the latest proposed kernel. This is not a
small jump and you should consider carefully if this will be the right thing to
do on your platform. In our case we found over the last month that this has
been a very reliable update. And most importantly, it fixed the performance
issue! Things may have changed in the intervening period and this patch may
be back-ported to the LTS stream. I did not look into patching for other
distributions.
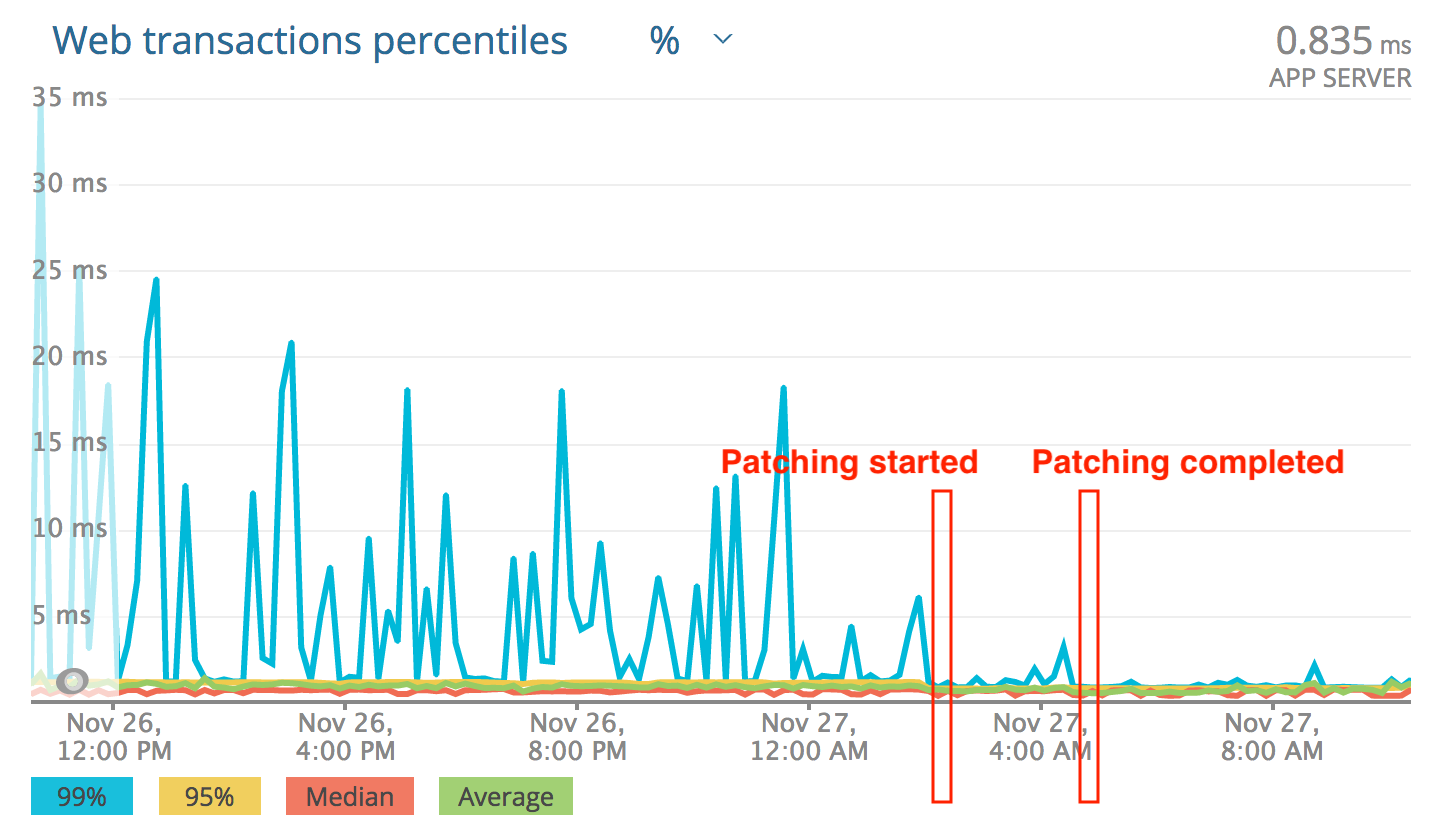
What we’ve seen is a pretty dramatic improvement in a number of applications. I think that the description the kernel issue under sells the effect. At least on the various workloads in our system. Here are some more charts, this time from New Relic:
Patching the system, one application’s view:
Same application, before and after:
The most dramatically affected:

Wrap Up
Is this affecting your apps? Maybe. Is it worth fixing? Maybe. For us both of
those are definitely true. You should at least look into it. We’ve seen very
noticeable improvements in latency, but also in throughput for the same amount
of CPU for certain applications. It has stabilized throughput and latency in a
few parts of the system that were a lot less predictable before. Applying the
proposed stream to our production boxes and getting all of our environments
patched was a big step, but it has paid off. We at
Community all hope this article helps someone else!
